Errors in logs - related to stats?

wluke
66 Posts
February 23, 2023, 8:52 pmQuote from wluke on February 23, 2023, 8:52 pmHi there,
For a number of months now (perhaps since 3.1 update, maybe before) we've been seeing the following errors in the logs of all the nodes, repeating:
23/02/2023 20:46:17 ERROR Error running echo command :echo "PetaSAN.NodeStats.gl-san-02a.cpu_all.percent_util 13.61 `date +%s`" "
23/02/2023 20:46:17 ERROR Node Stats exception.
PetaSAN.NodeStats.gl-san-02a.ifaces.throughput.bond0-20_received 50564352.0 `date +%s`" | nc -v -q0 192.168.37.138 2003
PetaSAN.NodeStats.gl-san-02a.ifaces.percent_util.bond0-20 1.01 `date +%s`" "
PetaSAN.NodeStats.gl-san-02a.ifaces.throughput.bond0-1_transmitted 240035.84 `date +%s`" "
PetaSAN.NodeStats.gl-san-02a.ifaces.throughput.bond0-1_received 438292.48 `date +%s`" "
PetaSAN.NodeStats.gl-san-02a.ifaces.percent_util.bond0-1 0.01 `date +%s`" "
PetaSAN.NodeStats.gl-san-02a.ifaces.throughput.bond0_transmitted 42225715.2 `date +%s`" "
PetaSAN.NodeStats.gl-san-02a.ifaces.throughput.bond0_received 51456921.6 `date +%s`" "
PetaSAN.NodeStats.gl-san-02a.ifaces.percent_util.bond0 1.03 `date +%s`" "
PetaSAN.NodeStats.gl-san-02a.memory.percent_util 23.98 `date +%s`" "
Exception: Error running echo command :echo "PetaSAN.NodeStats.gl-san-02a.cpu_all.percent_util 14.81 `date +%s`" "
raise Exception("Error running echo command :" + cmd)
File "/usr/lib/python3/dist-packages/PetaSAN/core/common/graphite_sender.py", line 59, in send
graphite_sender.send(leader_ip)
File "/opt/petasan/scripts/node_stats.py", line 66, in get_stats
get_stats()
File "/opt/petasan/scripts/node_stats.py", line 168, in <module>
Traceback (most recent call last):
PetaSAN.NodeStats.gl-san-02a.ifaces.throughput.bond0-20_received 50564352.0 `date +%s`" | nc -v -q0 192.168.37.138 2003
PetaSAN.NodeStats.gl-san-02a.ifaces.percent_util.bond0-20 1.01 `date +%s`" "
PetaSAN.NodeStats.gl-san-02a.ifaces.throughput.bond0-1_transmitted 240035.84 `date +%s`" "
PetaSAN.NodeStats.gl-san-02a.ifaces.throughput.bond0-1_received 438292.48 `date +%s`" "
PetaSAN.NodeStats.gl-san-02a.ifaces.percent_util.bond0-1 0.01 `date +%s`" "
PetaSAN.NodeStats.gl-san-02a.ifaces.throughput.bond0_transmitted 42225715.2 `date +%s`" "
PetaSAN.NodeStats.gl-san-02a.ifaces.throughput.bond0_received 51456921.6 `date +%s`" "
PetaSAN.NodeStats.gl-san-02a.ifaces.percent_util.bond0 1.03 `date +%s`" "
PetaSAN.NodeStats.gl-san-02a.memory.percent_util 23.98 `date +%s`" "
I think this causes the stats pages related to the nodes to show as blank, as well as making spotting other issues in the logs somewhat difficult.
Have you any suggestions as to what may be causing it, and how to fix it?
One additional question - we're seeing the deep scrubs often not quite complete in time, and so we get the warnings such as "2 pgs not deep-scrubbed in time" for time to time, which puts the cluster in a warning state - is there a way to drop the frequency of the scrubs so that they have plenty of time to complete (we've tried increasing the speed, but this causes performance issues, the LVM caches start to fill up as the HDDs are under heavy read load and are unable to handle enough writes)
Thanks!
Hi there,
For a number of months now (perhaps since 3.1 update, maybe before) we've been seeing the following errors in the logs of all the nodes, repeating:
23/02/2023 20:46:17 ERROR Error running echo command :echo "PetaSAN.NodeStats.gl-san-02a.cpu_all.percent_util 13.61 `date +%s`" "
23/02/2023 20:46:17 ERROR Node Stats exception.
PetaSAN.NodeStats.gl-san-02a.ifaces.throughput.bond0-20_received 50564352.0 `date +%s`" | nc -v -q0 192.168.37.138 2003
PetaSAN.NodeStats.gl-san-02a.ifaces.percent_util.bond0-20 1.01 `date +%s`" "
PetaSAN.NodeStats.gl-san-02a.ifaces.throughput.bond0-1_transmitted 240035.84 `date +%s`" "
PetaSAN.NodeStats.gl-san-02a.ifaces.throughput.bond0-1_received 438292.48 `date +%s`" "
PetaSAN.NodeStats.gl-san-02a.ifaces.percent_util.bond0-1 0.01 `date +%s`" "
PetaSAN.NodeStats.gl-san-02a.ifaces.throughput.bond0_transmitted 42225715.2 `date +%s`" "
PetaSAN.NodeStats.gl-san-02a.ifaces.throughput.bond0_received 51456921.6 `date +%s`" "
PetaSAN.NodeStats.gl-san-02a.ifaces.percent_util.bond0 1.03 `date +%s`" "
PetaSAN.NodeStats.gl-san-02a.memory.percent_util 23.98 `date +%s`" "
Exception: Error running echo command :echo "PetaSAN.NodeStats.gl-san-02a.cpu_all.percent_util 14.81 `date +%s`" "
raise Exception("Error running echo command :" + cmd)
File "/usr/lib/python3/dist-packages/PetaSAN/core/common/graphite_sender.py", line 59, in send
graphite_sender.send(leader_ip)
File "/opt/petasan/scripts/node_stats.py", line 66, in get_stats
get_stats()
File "/opt/petasan/scripts/node_stats.py", line 168, in <module>
Traceback (most recent call last):
PetaSAN.NodeStats.gl-san-02a.ifaces.throughput.bond0-20_received 50564352.0 `date +%s`" | nc -v -q0 192.168.37.138 2003
PetaSAN.NodeStats.gl-san-02a.ifaces.percent_util.bond0-20 1.01 `date +%s`" "
PetaSAN.NodeStats.gl-san-02a.ifaces.throughput.bond0-1_transmitted 240035.84 `date +%s`" "
PetaSAN.NodeStats.gl-san-02a.ifaces.throughput.bond0-1_received 438292.48 `date +%s`" "
PetaSAN.NodeStats.gl-san-02a.ifaces.percent_util.bond0-1 0.01 `date +%s`" "
PetaSAN.NodeStats.gl-san-02a.ifaces.throughput.bond0_transmitted 42225715.2 `date +%s`" "
PetaSAN.NodeStats.gl-san-02a.ifaces.throughput.bond0_received 51456921.6 `date +%s`" "
PetaSAN.NodeStats.gl-san-02a.ifaces.percent_util.bond0 1.03 `date +%s`" "
PetaSAN.NodeStats.gl-san-02a.memory.percent_util 23.98 `date +%s`" "
I think this causes the stats pages related to the nodes to show as blank, as well as making spotting other issues in the logs somewhat difficult.
Have you any suggestions as to what may be causing it, and how to fix it?
One additional question - we're seeing the deep scrubs often not quite complete in time, and so we get the warnings such as "2 pgs not deep-scrubbed in time" for time to time, which puts the cluster in a warning state - is there a way to drop the frequency of the scrubs so that they have plenty of time to complete (we've tried increasing the speed, but this causes performance issues, the LVM caches start to fill up as the HDDs are under heavy read load and are unable to handle enough writes)
Thanks!

admin
2,959 Posts
February 23, 2023, 10:38 pmQuote from admin on February 23, 2023, 10:38 pmit could be network issues or load issues. does the error happen all the time ? is the system stressed ? run atop and look at load on cpu/disk/net.
it could be network issues or load issues. does the error happen all the time ? is the system stressed ? run atop and look at load on cpu/disk/net.

wluke
66 Posts
February 24, 2023, 8:46 amQuote from wluke on February 24, 2023, 8:46 amHi, it happens all the time, constantly, and it happens on all 5 nodes.
The system isn't stressed. For example right now
Network: eth0 (iscsiA) 60Mbs / 10G, eth1 (iscsiB) 57Mbs / 10G, bond0 170Mbs / 40G
CPU (72cores): avg 15-18%
Memory: 256GB total, free 2.8G, cache 2.0G, buff 105G
Disk: only the nvmes show busy (but with low latency, and not much throughput - I believe they always read like this way in this kernel)
Thanks
Hi, it happens all the time, constantly, and it happens on all 5 nodes.
The system isn't stressed. For example right now
Network: eth0 (iscsiA) 60Mbs / 10G, eth1 (iscsiB) 57Mbs / 10G, bond0 170Mbs / 40G
CPU (72cores): avg 15-18%
Memory: 256GB total, free 2.8G, cache 2.0G, buff 105G
Disk: only the nvmes show busy (but with low latency, and not much throughput - I believe they always read like this way in this kernel)
Thanks
Last edited on February 24, 2023, 8:47 am by wluke · #3

admin
2,959 Posts
February 25, 2023, 9:31 pmQuote from admin on February 25, 2023, 9:31 pm1) get the stats server ip from
/opt/petasan/scripts/util/get_cluster_leader.py
2) on node which is stats server, try
/opt/petasan/scripts/stats-stop.sh
/opt/petasan/scripts/stats-setup.sh
/opt/petasan/scripts/stats-start.sh
3) If this does not fix issues, on all nodes do a
systemctl restart petasan-node-stats
1) get the stats server ip from
/opt/petasan/scripts/util/get_cluster_leader.py
2) on node which is stats server, try
/opt/petasan/scripts/stats-stop.sh
/opt/petasan/scripts/stats-setup.sh
/opt/petasan/scripts/stats-start.sh
3) If this does not fix issues, on all nodes do a
systemctl restart petasan-node-stats

wluke
66 Posts
March 3, 2023, 5:35 pmQuote from wluke on March 3, 2023, 5:35 pmThat's fixed it! Thanks!
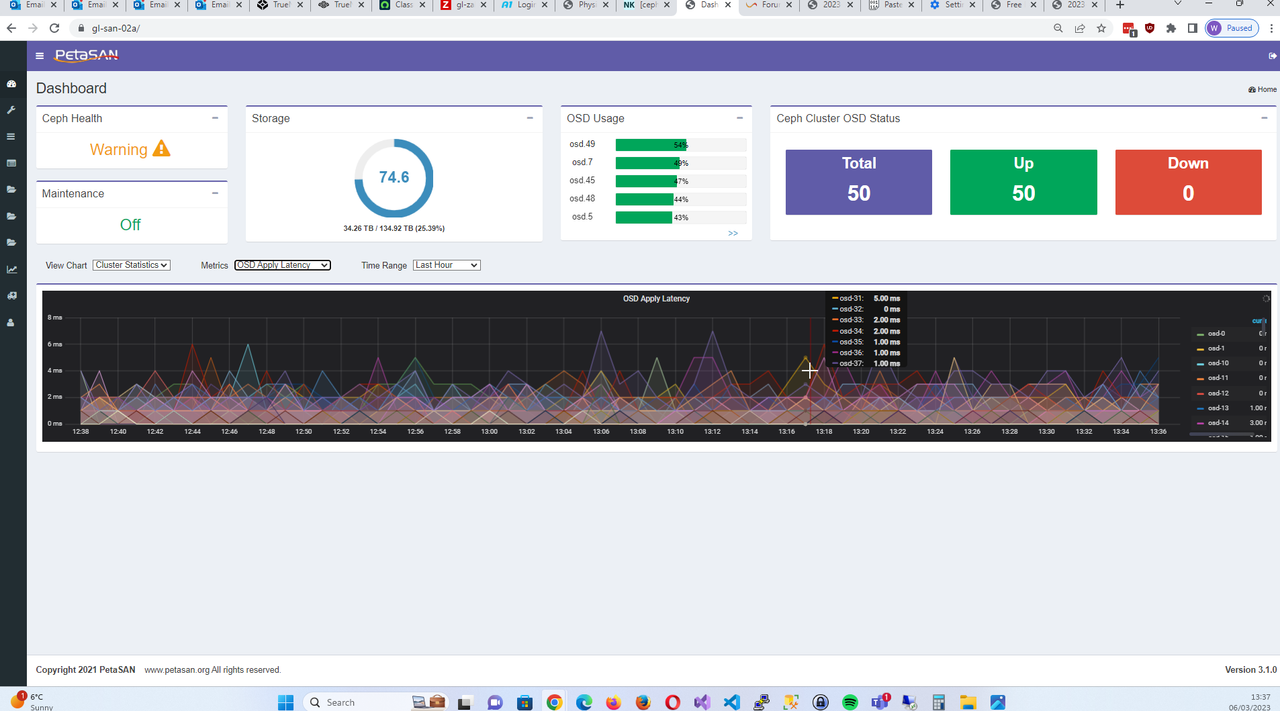
Is there a way to adjust the layout or size of the stats screen? The popup to show the numbers is off the edge of the iframe when mousing over
That's fixed it! Thanks!
Is there a way to adjust the layout or size of the stats screen? The popup to show the numbers is off the edge of the iframe when mousing over

admin
2,959 Posts
March 4, 2023, 4:33 amQuote from admin on March 4, 2023, 4:33 amwhat browser are you using ? can you show a screenshot ?
what browser are you using ? can you show a screenshot ?

wluke
66 Posts
March 6, 2023, 1:40 pmQuote from wluke on March 6, 2023, 1:40 pmHi,
I'm using Google Chrome (Version 110.0.5481.178 (Official Build) (64-bit))
This is full screen on 1920 x 1080 display

Hi,
I'm using Google Chrome (Version 110.0.5481.178 (Official Build) (64-bit))
This is full screen on 1920 x 1080 display

Errors in logs - related to stats?
wluke
66 Posts
Quote from wluke on February 23, 2023, 8:52 pmHi there,
For a number of months now (perhaps since 3.1 update, maybe before) we've been seeing the following errors in the logs of all the nodes, repeating:
23/02/2023 20:46:17 ERROR Error running echo command :echo "PetaSAN.NodeStats.gl-san-02a.cpu_all.percent_util 13.61 `date +%s`" "
23/02/2023 20:46:17 ERROR Node Stats exception.
PetaSAN.NodeStats.gl-san-02a.ifaces.throughput.bond0-20_received 50564352.0 `date +%s`" | nc -v -q0 192.168.37.138 2003
PetaSAN.NodeStats.gl-san-02a.ifaces.percent_util.bond0-20 1.01 `date +%s`" "
PetaSAN.NodeStats.gl-san-02a.ifaces.throughput.bond0-1_transmitted 240035.84 `date +%s`" "
PetaSAN.NodeStats.gl-san-02a.ifaces.throughput.bond0-1_received 438292.48 `date +%s`" "
PetaSAN.NodeStats.gl-san-02a.ifaces.percent_util.bond0-1 0.01 `date +%s`" "
PetaSAN.NodeStats.gl-san-02a.ifaces.throughput.bond0_transmitted 42225715.2 `date +%s`" "
PetaSAN.NodeStats.gl-san-02a.ifaces.throughput.bond0_received 51456921.6 `date +%s`" "
PetaSAN.NodeStats.gl-san-02a.ifaces.percent_util.bond0 1.03 `date +%s`" "
PetaSAN.NodeStats.gl-san-02a.memory.percent_util 23.98 `date +%s`" "
Exception: Error running echo command :echo "PetaSAN.NodeStats.gl-san-02a.cpu_all.percent_util 14.81 `date +%s`" "
raise Exception("Error running echo command :" + cmd)
File "/usr/lib/python3/dist-packages/PetaSAN/core/common/graphite_sender.py", line 59, in send
graphite_sender.send(leader_ip)
File "/opt/petasan/scripts/node_stats.py", line 66, in get_stats
get_stats()
File "/opt/petasan/scripts/node_stats.py", line 168, in <module>
Traceback (most recent call last):
PetaSAN.NodeStats.gl-san-02a.ifaces.throughput.bond0-20_received 50564352.0 `date +%s`" | nc -v -q0 192.168.37.138 2003
PetaSAN.NodeStats.gl-san-02a.ifaces.percent_util.bond0-20 1.01 `date +%s`" "
PetaSAN.NodeStats.gl-san-02a.ifaces.throughput.bond0-1_transmitted 240035.84 `date +%s`" "
PetaSAN.NodeStats.gl-san-02a.ifaces.throughput.bond0-1_received 438292.48 `date +%s`" "
PetaSAN.NodeStats.gl-san-02a.ifaces.percent_util.bond0-1 0.01 `date +%s`" "
PetaSAN.NodeStats.gl-san-02a.ifaces.throughput.bond0_transmitted 42225715.2 `date +%s`" "
PetaSAN.NodeStats.gl-san-02a.ifaces.throughput.bond0_received 51456921.6 `date +%s`" "
PetaSAN.NodeStats.gl-san-02a.ifaces.percent_util.bond0 1.03 `date +%s`" "
PetaSAN.NodeStats.gl-san-02a.memory.percent_util 23.98 `date +%s`" "I think this causes the stats pages related to the nodes to show as blank, as well as making spotting other issues in the logs somewhat difficult.
Have you any suggestions as to what may be causing it, and how to fix it?
One additional question - we're seeing the deep scrubs often not quite complete in time, and so we get the warnings such as "2 pgs not deep-scrubbed in time" for time to time, which puts the cluster in a warning state - is there a way to drop the frequency of the scrubs so that they have plenty of time to complete (we've tried increasing the speed, but this causes performance issues, the LVM caches start to fill up as the HDDs are under heavy read load and are unable to handle enough writes)
Thanks!
Hi there,
For a number of months now (perhaps since 3.1 update, maybe before) we've been seeing the following errors in the logs of all the nodes, repeating:
23/02/2023 20:46:17 ERROR Error running echo command :echo "PetaSAN.NodeStats.gl-san-02a.cpu_all.percent_util 13.61 `date +%s`" "
23/02/2023 20:46:17 ERROR Node Stats exception.
PetaSAN.NodeStats.gl-san-02a.ifaces.throughput.bond0-20_received 50564352.0 `date +%s`" | nc -v -q0 192.168.37.138 2003
PetaSAN.NodeStats.gl-san-02a.ifaces.percent_util.bond0-20 1.01 `date +%s`" "
PetaSAN.NodeStats.gl-san-02a.ifaces.throughput.bond0-1_transmitted 240035.84 `date +%s`" "
PetaSAN.NodeStats.gl-san-02a.ifaces.throughput.bond0-1_received 438292.48 `date +%s`" "
PetaSAN.NodeStats.gl-san-02a.ifaces.percent_util.bond0-1 0.01 `date +%s`" "
PetaSAN.NodeStats.gl-san-02a.ifaces.throughput.bond0_transmitted 42225715.2 `date +%s`" "
PetaSAN.NodeStats.gl-san-02a.ifaces.throughput.bond0_received 51456921.6 `date +%s`" "
PetaSAN.NodeStats.gl-san-02a.ifaces.percent_util.bond0 1.03 `date +%s`" "
PetaSAN.NodeStats.gl-san-02a.memory.percent_util 23.98 `date +%s`" "
Exception: Error running echo command :echo "PetaSAN.NodeStats.gl-san-02a.cpu_all.percent_util 14.81 `date +%s`" "
raise Exception("Error running echo command :" + cmd)
File "/usr/lib/python3/dist-packages/PetaSAN/core/common/graphite_sender.py", line 59, in send
graphite_sender.send(leader_ip)
File "/opt/petasan/scripts/node_stats.py", line 66, in get_stats
get_stats()
File "/opt/petasan/scripts/node_stats.py", line 168, in <module>
Traceback (most recent call last):
PetaSAN.NodeStats.gl-san-02a.ifaces.throughput.bond0-20_received 50564352.0 `date +%s`" | nc -v -q0 192.168.37.138 2003
PetaSAN.NodeStats.gl-san-02a.ifaces.percent_util.bond0-20 1.01 `date +%s`" "
PetaSAN.NodeStats.gl-san-02a.ifaces.throughput.bond0-1_transmitted 240035.84 `date +%s`" "
PetaSAN.NodeStats.gl-san-02a.ifaces.throughput.bond0-1_received 438292.48 `date +%s`" "
PetaSAN.NodeStats.gl-san-02a.ifaces.percent_util.bond0-1 0.01 `date +%s`" "
PetaSAN.NodeStats.gl-san-02a.ifaces.throughput.bond0_transmitted 42225715.2 `date +%s`" "
PetaSAN.NodeStats.gl-san-02a.ifaces.throughput.bond0_received 51456921.6 `date +%s`" "
PetaSAN.NodeStats.gl-san-02a.ifaces.percent_util.bond0 1.03 `date +%s`" "
PetaSAN.NodeStats.gl-san-02a.memory.percent_util 23.98 `date +%s`" "
I think this causes the stats pages related to the nodes to show as blank, as well as making spotting other issues in the logs somewhat difficult.
Have you any suggestions as to what may be causing it, and how to fix it?
One additional question - we're seeing the deep scrubs often not quite complete in time, and so we get the warnings such as "2 pgs not deep-scrubbed in time" for time to time, which puts the cluster in a warning state - is there a way to drop the frequency of the scrubs so that they have plenty of time to complete (we've tried increasing the speed, but this causes performance issues, the LVM caches start to fill up as the HDDs are under heavy read load and are unable to handle enough writes)
Thanks!
admin
2,959 Posts
Quote from admin on February 23, 2023, 10:38 pmit could be network issues or load issues. does the error happen all the time ? is the system stressed ? run atop and look at load on cpu/disk/net.
it could be network issues or load issues. does the error happen all the time ? is the system stressed ? run atop and look at load on cpu/disk/net.
wluke
66 Posts
Quote from wluke on February 24, 2023, 8:46 amHi, it happens all the time, constantly, and it happens on all 5 nodes.
The system isn't stressed. For example right now
Network: eth0 (iscsiA) 60Mbs / 10G, eth1 (iscsiB) 57Mbs / 10G, bond0 170Mbs / 40G
CPU (72cores): avg 15-18%
Memory: 256GB total, free 2.8G, cache 2.0G, buff 105G
Disk: only the nvmes show busy (but with low latency, and not much throughput - I believe they always read like this way in this kernel)
Thanks
Hi, it happens all the time, constantly, and it happens on all 5 nodes.
The system isn't stressed. For example right now
Network: eth0 (iscsiA) 60Mbs / 10G, eth1 (iscsiB) 57Mbs / 10G, bond0 170Mbs / 40G
CPU (72cores): avg 15-18%
Memory: 256GB total, free 2.8G, cache 2.0G, buff 105G
Disk: only the nvmes show busy (but with low latency, and not much throughput - I believe they always read like this way in this kernel)
Thanks
admin
2,959 Posts
Quote from admin on February 25, 2023, 9:31 pm1) get the stats server ip from
/opt/petasan/scripts/util/get_cluster_leader.py
2) on node which is stats server, try/opt/petasan/scripts/stats-stop.sh
/opt/petasan/scripts/stats-setup.sh
/opt/petasan/scripts/stats-start.sh3) If this does not fix issues, on all nodes do a
systemctl restart petasan-node-stats
1) get the stats server ip from
/opt/petasan/scripts/util/get_cluster_leader.py
2) on node which is stats server, try
/opt/petasan/scripts/stats-stop.sh
/opt/petasan/scripts/stats-setup.sh
/opt/petasan/scripts/stats-start.sh
3) If this does not fix issues, on all nodes do a
systemctl restart petasan-node-stats
wluke
66 Posts
Quote from wluke on March 3, 2023, 5:35 pmThat's fixed it! Thanks!
Is there a way to adjust the layout or size of the stats screen? The popup to show the numbers is off the edge of the iframe when mousing over
That's fixed it! Thanks!
Is there a way to adjust the layout or size of the stats screen? The popup to show the numbers is off the edge of the iframe when mousing over
admin
2,959 Posts
Quote from admin on March 4, 2023, 4:33 amwhat browser are you using ? can you show a screenshot ?
what browser are you using ? can you show a screenshot ?
wluke
66 Posts
Quote from wluke on March 6, 2023, 1:40 pmHi,
I'm using Google Chrome (Version 110.0.5481.178 (Official Build) (64-bit))
This is full screen on 1920 x 1080 display
Hi,
I'm using Google Chrome (Version 110.0.5481.178 (Official Build) (64-bit))
This is full screen on 1920 x 1080 display

