Determine storage space

trexman
60 Posts
June 4, 2020, 12:45 pmQuote from trexman on June 4, 2020, 12:45 pmHi,
I have another quick question. What is the easiest and reliable way to find out, how much space is left on a pool?
I see all the values on the dashboard but I'm unsure what is right one.
We have to move a few TB on the storage and I have to know if it fits or not.
Short to our environment: We use a 3 node PetaSAN via iSCSI disc on a VMware. (replicated size=3)
What I already did is a "vmfs unmap" on VMWare to reclaim the unused space.
I also did a OSD re-balance on Ceph because there were a little bit uneven used.
Both gave a few TB back.
Now I see on the Dashboard:
Pool ALL -> Available: 27.75TB, Total: 47.99TB, Used: 20.19 TB
Pool SSD -> Available: 8.33TB, Used: 20.19 TB
VMWare Vcenter shows: 6.34TB used
Now back to my question:
How much space is left or can be used in consideration of 3 replicas and the max usage of OSD before they are "full" or "near full"?
I know that PetaSAN gets annoying if you reach the 60% used mark 🙂
Thanks for clarify this.
Trexman
Hi,
I have another quick question. What is the easiest and reliable way to find out, how much space is left on a pool?
I see all the values on the dashboard but I'm unsure what is right one.
We have to move a few TB on the storage and I have to know if it fits or not.
Short to our environment: We use a 3 node PetaSAN via iSCSI disc on a VMware. (replicated size=3)
What I already did is a "vmfs unmap" on VMWare to reclaim the unused space.
I also did a OSD re-balance on Ceph because there were a little bit uneven used.
Both gave a few TB back.
Now I see on the Dashboard:
Pool ALL -> Available: 27.75TB, Total: 47.99TB, Used: 20.19 TB
Pool SSD -> Available: 8.33TB, Used: 20.19 TB
VMWare Vcenter shows: 6.34TB used
Now back to my question:
How much space is left or can be used in consideration of 3 replicas and the max usage of OSD before they are "full" or "near full"?
I know that PetaSAN gets annoying if you reach the 60% used mark 🙂
Thanks for clarify this.
Trexman

admin
2,969 Posts
June 5, 2020, 11:07 amQuote from admin on June 5, 2020, 11:07 amLook at the storage dashboard chart and look at usage per each pool rather than overall usage.
you can also use the ceph df command.
Look at the storage dashboard chart and look at usage per each pool rather than overall usage.
you can also use the ceph df command.

trexman
60 Posts
June 8, 2020, 11:11 amQuote from trexman on June 8, 2020, 11:11 amThis is what I did, but I still can't answer my question 🙂
So the Dashboard for the Pool SSD show the following last/actual value:
Available: 8.04TB
Used: 21.06 TB
ceph df:
POOL ID STORED OBJECTS USED %USED MAX AVAIL
SSD 2 6.4 TiB 1.93M 19 TiB 46.62 7.3 TiB
So these values are OK, but if I would write another 8TB on the disc the Ceph would stop working, because of full OSDs.
BTW: I think there is a wrong unit on the dashboard between the graph and the value.

How much space can now "securely" been used? (meaning that there is no warning or stopped iSCSI disc)
And how to get this remaining space value without calculations every time 😉
This is what I did, but I still can't answer my question 🙂
So the Dashboard for the Pool SSD show the following last/actual value:
Available: 8.04TB
Used: 21.06 TB
ceph df:
POOL ID STORED OBJECTS USED %USED MAX AVAIL
SSD 2 6.4 TiB 1.93M 19 TiB 46.62 7.3 TiB
So these values are OK, but if I would write another 8TB on the disc the Ceph would stop working, because of full OSDs.
BTW: I think there is a wrong unit on the dashboard between the graph and the value.

How much space can now "securely" been used? (meaning that there is no warning or stopped iSCSI disc)
And how to get this remaining space value without calculations every time 😉
Last edited on June 8, 2020, 11:13 am by trexman · #3

R3LZX
50 Posts
June 8, 2020, 5:17 pmQuote from R3LZX on June 8, 2020, 5:17 pm
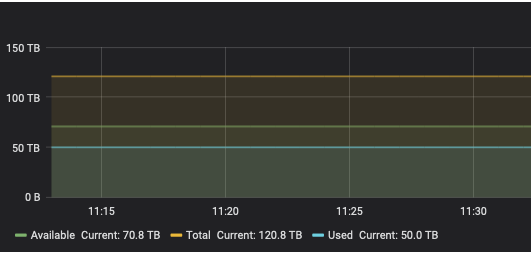
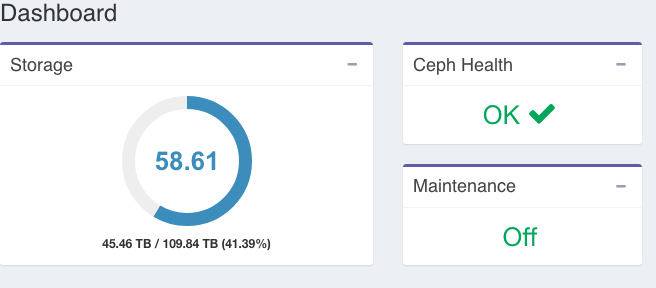
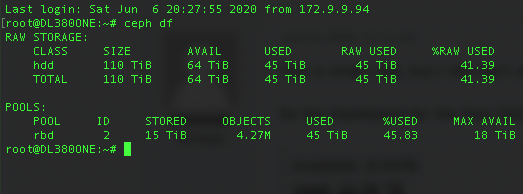
I have the same question, we only have 40TB in iscsi and it seems like as I add storage (fill up the iscsi device both as a windows server iscsi and vmware iscsi) it is showing more than it actually is supposed to be.
Currently showing 45TB being used


I have the same question, we only have 40TB in iscsi and it seems like as I add storage (fill up the iscsi device both as a windows server iscsi and vmware iscsi) it is showing more than it actually is supposed to be.
Currently showing 45TB being used
Last edited on June 8, 2020, 5:28 pm by R3LZX · #4

admin
2,969 Posts
June 8, 2020, 10:18 pmQuote from admin on June 8, 2020, 10:18 pmSome points:
The dashboard storage circle control is raw storage, this corresponds to the RAW: section of df command
The dashboard chart : shows pool storage (in addition to total): correspond to the POOLS: section of df command
RAW: 110 TiB total, 45 TiB used, 64 Tib Avail
Pool: 45 TiB used ( correspond to the RAW used since you have 1 pool ), stored 15 TiB ( net user data stored = 45 / 3 replicas ), Objects 4.2 M ( each object in rbd is 4MB size, you have 4.2 M objects ). This should all correlate with the RAW section.. now the difference: the 18 TiB MAX AVAIL is the amount of data that can be written to the rbd pool before its first OSD gets full, this is estimated based on the current max filled OSD in the pool, running the balancer module to balance data among OSDs will actually increase the MAX AVAIL.
MAX AVAIL in the df command and per pool charts in PetaSAN are a more realistic measure of how much data you can write before you get an error, the RAW figure is not. In version 2.5 we added notification email alarm on pool basis when it reaches 85% percent.
Some points:
The dashboard storage circle control is raw storage, this corresponds to the RAW: section of df command
The dashboard chart : shows pool storage (in addition to total): correspond to the POOLS: section of df command
RAW: 110 TiB total, 45 TiB used, 64 Tib Avail
Pool: 45 TiB used ( correspond to the RAW used since you have 1 pool ), stored 15 TiB ( net user data stored = 45 / 3 replicas ), Objects 4.2 M ( each object in rbd is 4MB size, you have 4.2 M objects ). This should all correlate with the RAW section.. now the difference: the 18 TiB MAX AVAIL is the amount of data that can be written to the rbd pool before its first OSD gets full, this is estimated based on the current max filled OSD in the pool, running the balancer module to balance data among OSDs will actually increase the MAX AVAIL.
MAX AVAIL in the df command and per pool charts in PetaSAN are a more realistic measure of how much data you can write before you get an error, the RAW figure is not. In version 2.5 we added notification email alarm on pool basis when it reaches 85% percent.
Last edited on June 8, 2020, 10:20 pm by admin · #5
Determine storage space
trexman
60 Posts
Quote from trexman on June 4, 2020, 12:45 pmHi,
I have another quick question. What is the easiest and reliable way to find out, how much space is left on a pool?
I see all the values on the dashboard but I'm unsure what is right one.
We have to move a few TB on the storage and I have to know if it fits or not.Short to our environment: We use a 3 node PetaSAN via iSCSI disc on a VMware. (replicated size=3)
What I already did is a "vmfs unmap" on VMWare to reclaim the unused space.
I also did a OSD re-balance on Ceph because there were a little bit uneven used.
Both gave a few TB back.Now I see on the Dashboard:
Pool ALL -> Available: 27.75TB, Total: 47.99TB, Used: 20.19 TB
Pool SSD -> Available: 8.33TB, Used: 20.19 TBVMWare Vcenter shows: 6.34TB used
Now back to my question:
How much space is left or can be used in consideration of 3 replicas and the max usage of OSD before they are "full" or "near full"?
I know that PetaSAN gets annoying if you reach the 60% used mark 🙂Thanks for clarify this.
Trexman
Hi,
I have another quick question. What is the easiest and reliable way to find out, how much space is left on a pool?
I see all the values on the dashboard but I'm unsure what is right one.
We have to move a few TB on the storage and I have to know if it fits or not.
Short to our environment: We use a 3 node PetaSAN via iSCSI disc on a VMware. (replicated size=3)
What I already did is a "vmfs unmap" on VMWare to reclaim the unused space.
I also did a OSD re-balance on Ceph because there were a little bit uneven used.
Both gave a few TB back.
Now I see on the Dashboard:
Pool ALL -> Available: 27.75TB, Total: 47.99TB, Used: 20.19 TB
Pool SSD -> Available: 8.33TB, Used: 20.19 TB
VMWare Vcenter shows: 6.34TB used
Now back to my question:
How much space is left or can be used in consideration of 3 replicas and the max usage of OSD before they are "full" or "near full"?
I know that PetaSAN gets annoying if you reach the 60% used mark 🙂
Thanks for clarify this.
Trexman
admin
2,969 Posts
Quote from admin on June 5, 2020, 11:07 amLook at the storage dashboard chart and look at usage per each pool rather than overall usage.
you can also use the ceph df command.
Look at the storage dashboard chart and look at usage per each pool rather than overall usage.
you can also use the ceph df command.
trexman
60 Posts
Quote from trexman on June 8, 2020, 11:11 amThis is what I did, but I still can't answer my question 🙂
So the Dashboard for the Pool SSD show the following last/actual value:
Available: 8.04TB
Used: 21.06 TBceph df:
POOL ID STORED OBJECTS USED %USED MAX AVAIL
SSD 2 6.4 TiB 1.93M 19 TiB 46.62 7.3 TiBSo these values are OK, but if I would write another 8TB on the disc the Ceph would stop working, because of full OSDs.
BTW: I think there is a wrong unit on the dashboard between the graph and the value.
How much space can now "securely" been used? (meaning that there is no warning or stopped iSCSI disc)
And how to get this remaining space value without calculations every time 😉
This is what I did, but I still can't answer my question 🙂
So the Dashboard for the Pool SSD show the following last/actual value:
Available: 8.04TB
Used: 21.06 TB
ceph df:
POOL ID STORED OBJECTS USED %USED MAX AVAIL
SSD 2 6.4 TiB 1.93M 19 TiB 46.62 7.3 TiB
So these values are OK, but if I would write another 8TB on the disc the Ceph would stop working, because of full OSDs.
BTW: I think there is a wrong unit on the dashboard between the graph and the value.

How much space can now "securely" been used? (meaning that there is no warning or stopped iSCSI disc)
And how to get this remaining space value without calculations every time 😉
R3LZX
50 Posts
Quote from R3LZX on June 8, 2020, 5:17 pm
I have the same question, we only have 40TB in iscsi and it seems like as I add storage (fill up the iscsi device both as a windows server iscsi and vmware iscsi) it is showing more than it actually is supposed to be.
Currently showing 45TB being used


I have the same question, we only have 40TB in iscsi and it seems like as I add storage (fill up the iscsi device both as a windows server iscsi and vmware iscsi) it is showing more than it actually is supposed to be.
Currently showing 45TB being used
admin
2,969 Posts
Quote from admin on June 8, 2020, 10:18 pmSome points:
The dashboard storage circle control is raw storage, this corresponds to the RAW: section of df command
The dashboard chart : shows pool storage (in addition to total): correspond to the POOLS: section of df command
RAW: 110 TiB total, 45 TiB used, 64 Tib Avail
Pool: 45 TiB used ( correspond to the RAW used since you have 1 pool ), stored 15 TiB ( net user data stored = 45 / 3 replicas ), Objects 4.2 M ( each object in rbd is 4MB size, you have 4.2 M objects ). This should all correlate with the RAW section.. now the difference: the 18 TiB MAX AVAIL is the amount of data that can be written to the rbd pool before its first OSD gets full, this is estimated based on the current max filled OSD in the pool, running the balancer module to balance data among OSDs will actually increase the MAX AVAIL.
MAX AVAIL in the df command and per pool charts in PetaSAN are a more realistic measure of how much data you can write before you get an error, the RAW figure is not. In version 2.5 we added notification email alarm on pool basis when it reaches 85% percent.
Some points:
The dashboard storage circle control is raw storage, this corresponds to the RAW: section of df command
The dashboard chart : shows pool storage (in addition to total): correspond to the POOLS: section of df command
RAW: 110 TiB total, 45 TiB used, 64 Tib Avail
Pool: 45 TiB used ( correspond to the RAW used since you have 1 pool ), stored 15 TiB ( net user data stored = 45 / 3 replicas ), Objects 4.2 M ( each object in rbd is 4MB size, you have 4.2 M objects ). This should all correlate with the RAW section.. now the difference: the 18 TiB MAX AVAIL is the amount of data that can be written to the rbd pool before its first OSD gets full, this is estimated based on the current max filled OSD in the pool, running the balancer module to balance data among OSDs will actually increase the MAX AVAIL.
MAX AVAIL in the df command and per pool charts in PetaSAN are a more realistic measure of how much data you can write before you get an error, the RAW figure is not. In version 2.5 we added notification email alarm on pool basis when it reaches 85% percent.
